Hierarchical Clustering (Python)
Published:
by
Authur Lee
![]()
- Categories:
- MachineLearning 9
Clustering?
Clustering is the task of grouping a set of objects in such a way that objects in the same group (called a cluster) are more similar (in some sense) to each other than to those in other groups (clusters).
Clustering VS Classification
Classification and clustering are two methods of pattern identification used in machine learning. Although both techniques have certain similarities, the difference lies in the fact that classification uses predefined classes in which objects are assigned, while clustering identifies similarities between objects, which it groups according to those characteristics in common and which differentiate them from other groups of objects. These groups are known as "clusters".
In the field of machine learning (a form of artificial intelligence), clustering is framed in unsupervised learning; that is, for this type of algorithm we only have one set of input data (not labelled), about which we must obtain information, without previously knowing what the output will be.
The whole project
Read Data
In this project, I got several xlsx files.
Read xlsx file
import xlrd
file_location = ".../file_name.xlsx"
data = xlrd.open_workbook(file_location)
For a xlsx file, it may not contain only one sheet, so we can use .sheet_by_index() to assign the sheet to a variable like sheet_0 below. And it should not be neglected that the index of the sheet starts from 0.
sheet_0 = data.sheet_by_index(0)
Covert to csv file and read it
Convert the xlsx file containing the original data to a csv file, and then read it.
A xlsx file may contain several sheets, then we can use index_col, while the index of sheets starts from 0 as mentioned before.
For example, in the codes below, we choose the second sheet in the
xlsxfile and convert it to a csv file.
import pandas as pd
import xlrd

def xlsx_to_csv_pd():
    data_xls = pd.read_excel('.../file.xlsx', index_col=1)
    data_xls.to_csv('.../file.csv', encoding='utf-8')

xlsx_to_csv_pd()

data_0 = pd.read_csv('.../file.csv')
Preprocessing data
Delete some columns in the data frame named data_0.
del data_0['the name of the column you wanna delete']
# i.e.
del data_0['2类'], data_0['3类'], data_0['4类'], data_0['公司名称']
Get the shape of a data frame: [number of rows, number of cols]
data_0.shape
Initial a data frame
For convenience, a 2-dimensional array is initialed and then converted to a data frame.
import numpy as np

# initial a rows-by-cols matrix
array = np.array(range(rows * cols)).reshape(rows, cols)
# assign values to the elements of the matrix
....
# covert the 2d array to a data frame
df = pd.DataFrame(array)
Normalize the data
for a matrix:
import numpy as np

def normalization(data):
  return (data - np.min(data)) / (np.max(data) - np.min(data))

adjacent_matrix_normalization = normalization(adjacent_matrix)
for a data frame:
from sklearn.preprocessing import normalize
df_4d_scaled = normalize(df_4d)
df_4d_scaled = pd.DataFrame(df_4d_scaled, columns=df_4d.columns)
df_4d_scaled.head()
Hierarchical Clustering
import scipy.cluster.hierarchy as shc
plt.figure(figsize=(10, 7))
plt.title("Dendrograms: x = " + str(x))
dend = shc.dendrogram(shc.linkage(df_4d_scaled, method='ward'))
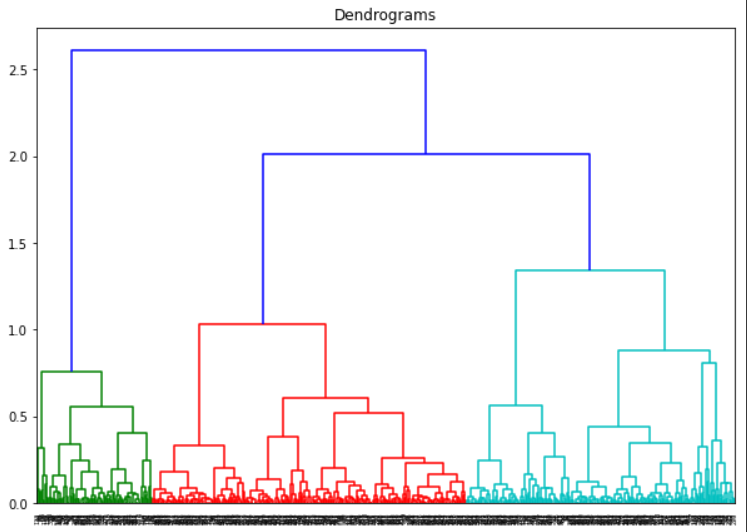
Observing the dendrogram above, we can know the optimal number of clusters should be THREE, which is shown intuitively since the three different colors: green, red, and blue. However, if all the lines are black, how to determine the optimal number of groups?
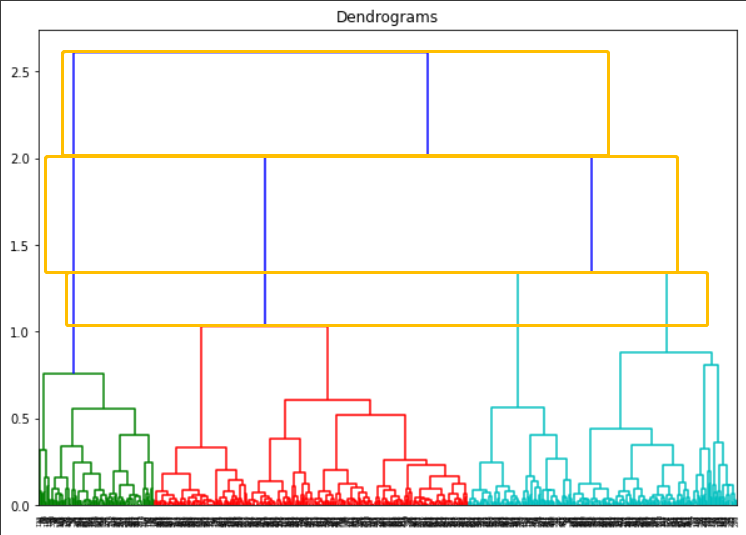
The method is to look for a horizontal rectangles whose maximum height does not cross any horizontal vertical tree line. As shown in the figure below, comparing these three orange rectangles with maximum heights, obviously the second one (from the top) is the rectangle we want. Hence, the optimal numbers of clusters are 3 corresponding to the max-height rectangle.
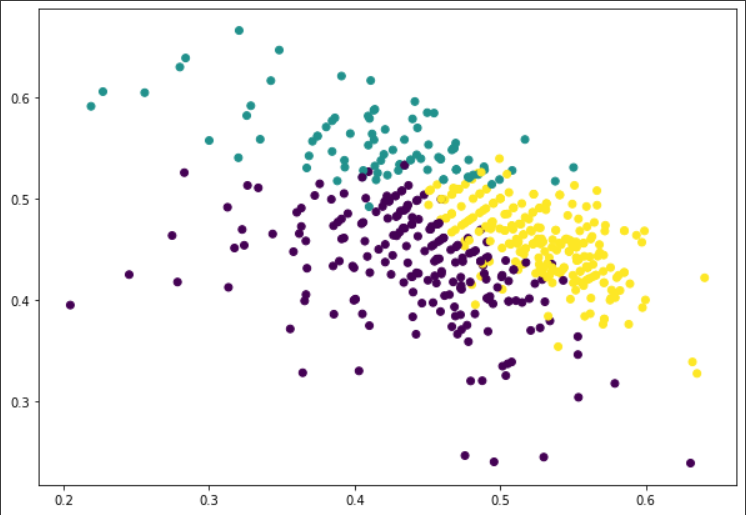
After the number of clusters is got, we can draw a 2-dimensional graph for the points in n-dimensional space, see figure below. where points are divided into 3 clusters.
from sklearn.cluster import AgglomerativeClustering

# number of clusters
n_groups = 3
# determine the axes of the final graph
graphd1, graphd2 = 0, 3

cluster = AgglomerativeClustering(n_clusters=n_groups, affinity='euclidean', linkage='ward')
cluster.fit_predict(df_4d_scaled)
plt.figure(figsize=(10, 7))
plt.scatter(df_4d_scaled[graphd1], df_4d_scaled[graphd2], c = cluster.labels_)
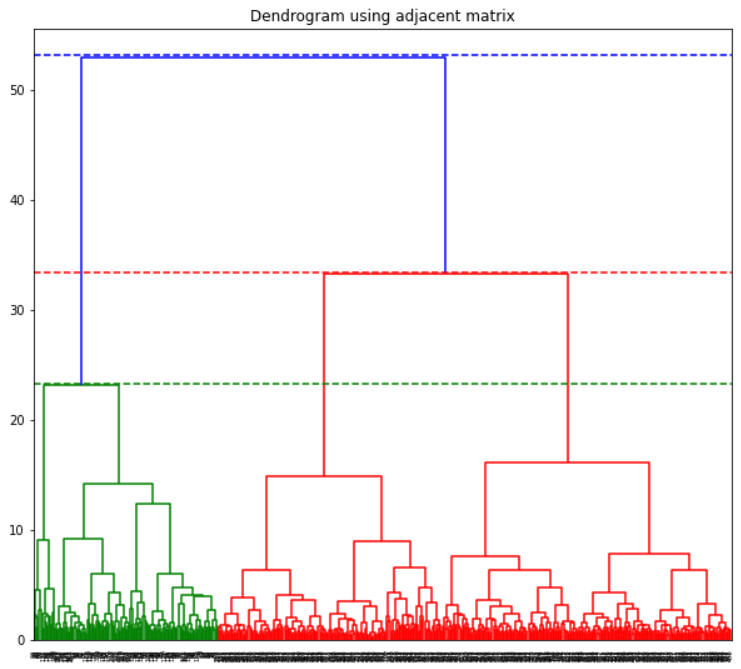
Another way drawing Dendrograms
In this approach, we define the adjacent matrix on our own and build the dendrogram using the adjacent matrix.
# adjacent_matrix_normalization is a adjacent matrix that has been normalized
Z = linkage(adjacent_matrix_normalization, method="ward", metric="euclidean", optimal_ordering=False)
f = fcluster(Z, t=2, criterion='maxclust')
print("平面聚类结果:", f)

fig = plt.figure(figsize=(10,9))
dn = dendrogram(Z)
plt.title("Dendrogram using adjacent matrix")
plt.axhline(y=53.2, color='b', linestyle='--')
plt.axhline(y=33.4, color='r', linestyle='--')
plt.axhline(y=23.3, color='g', linestyle='--')
plt.show()
References
- Cluster Analysis. (n.d.). Wikipedia. https://en.wikipedia.org/wiki/Cluster_analysis
- Classification Vs. Clustering - A Practical Explanation. (n.d.). Bismart. https://blog.bismart.com/en/classification-vs.-clustering-a-practical-explanation
- 层级聚类和Python实现的初学者指南. (n.d.). 机器之心. https://www.jiqizhixin.com/articles/2020-11-12-2
- 聚类树状图_聚集聚类和树状图-解释. (n.d.). CSDN. https://blog.csdn.net/weixin_26752765/article/details/108133419